
Most of the people just look at stock charts and see noise. On the other hand, an experienced trader sees structure. Trends build, levels get tested, momentum shifts, and those small clues mostly decide if a trade works or fails. Actually, the difference isn’t luck. Beyond that, it’s having a method just to read what exactly the market is already showing you.
At its core, swing trading technical analysis is all about timing. It’s the procedure of utilising price action, support and resistance, along with a few well-chosen indicators, in order to identify when a move is really likely to be continued or reversed. Rather than chasing momentum, you wait for confirmation and position yourself where the risk is managed as well as the reward makes sense.
In this guide, you’ll learn how to break down trades step by step, point out reliable setups, and ultimately approach the market with even more clarity and control.
What Is Swing Trading Technical Analysis

Swing trading is actually a style of trading, and it’s focused on capturing price moves that unfold over a few days to a few weeks. Rather than reacting to each small fluctuation, traders aim in order to follow short-term trends and exit when momentum starts to slow. This trading technique is a practical approach for those who want active participation without even being glued to the screen all day.
Here, technical analysis is what makes this approach work smartly. By studying swing trading charts, price action, and key levels, traders are able to identify patterns that are likely to be repeated. Numerous concepts like support and resistance, trend direction, along with momentum indicators help in identifying better entry and exit points.
Instead of guessing, traders make their decisions on how exactly the price behaves, which truly has more structure to trading.
Here’s how it compares to other styles:
- Swing Trading: Holds trades for a few days to weeks, and focuses on short-term trends.
- Day Trading: Trades within a single day need constant monitoring.
- Long-Term Investing: Holds positions for some months or sometimes years, based more on fundamentals.
Now, this balance makes it really a strong fit for traders who are looking to combine flexibility with a structured, technical analysis for a swing trading approach.
Why Swing Trading Technical Analysis Works in the Stock Market
The stock market isn’t really as random as it mostly feels. Here, price movements follow structure shaped by liquidity, volatility, market psychology, as well as institutional activity. These reasons create repeatable patterns and clear signals, and make technical analysis a practical way in order to identify chances and time trades efficiently:
High Liquidity in Active Stocks
Large-cap and frequently traded stocks provide tight spreads and smooth price movement, and make it totally easier to enter and exit trades without even any major slippage or unexpected price gaps.
Volatility Creates Trade Opportunities
Regular price swings in the market give opportunities consistently for short-term traders in order to capture moves, especially when volatility expands around key levels or sometimes market events.
Market Psychology Drives Patterns
Fear, greed, along with herd behaviour mostly repeat across cycles and result in recognisable chart patterns such as breakouts, pullbacks, and reversals that traders can use to their advantage.
Clear Entry and Exit Signals
Through price action and technical analysis for swing trading, traders can identify precise entry points, set logical stop losses, and define targets rather than being dependent on guesswork.
Institutional Activity Leaves Clues
Large players move markets, and their buying or selling always shows up through volume spikes and strong price reactions near key support or sometimes resistance zones.
Core Concepts Behind Successful Trades

These core concepts act as the backbone of any solid trading approach. Once you understand how price behaves around these factors, it becomes much easier to filter good setups from weak ones and make more confident decisions:
- Price Action and Candlesticks: Candles indicate actual selling and buying pressure. With a proper reading, you are able to notice changes in the momentum and the first indications of a reversal in the stock charts.
- Support and Resistance: These are significant price zones that the market is likely to respond to. They guide you on where to enter, leave, or evade trades in the chart analysis of stocks.
- Trend Structure: Markets move in trends. The identification of our higher highs and lower highs or vice versa maintains your trades in line with the overall trend in the market.
- Volume Confirmation: Volume represents the strength of a movement. The volume trend is increased by large volume, and low volume normally reflects bad setups in technical analysis and swing trading.
Best Indicators for Swing Trading Technical Analysis
The indicators are used to simplify the process of decision making by indicating the direction of a trend, momentum and volatility. You should not overload your chart, but rather just a small set of tools that will be compatible with your overall arrangement.
Moving Averages (Trend Direction and Dynamic Levels)
Moving averages such as 20 EMA or 50 SMA are used to determine the trend and usually serve as dynamic support or resistance against pullbacks.
RSI (Momentum and Overbought/Oversold Signals)
RSI is used to measure momentum and identify possible reversals when the price goes overbought or oversold, particularly at important levels.
MACD (Trend Confirmation)
MACD is used to validate the strength of the direction of a trend. Crossovers and divergences may represent possible entry or exit points.
Bollinger Bands (Volatility Insight)
Bollinger Bands extend and shrink around the volatility, and they allow you to discover the breakout or a possible reversal when the price moves too far.
Combining the Indicators to Effective Signals
The use of one indicator may result in falsification. It is more appropriate to use 2-3 indicators together with trading using price action.
It is an example of an overlay of a pullback to a moving average at support, combined with an overstatement of the oversold conditions on RSI, which forms a stronger and more credible set-up.
Swing Trading Technical Analysis Strategy step-by-step.
This is the point where it all comes together. Disciplined strategy allows you to make only well-thought-out trades and only in those situations that present an obvious advantage. Here’s the precise steps;
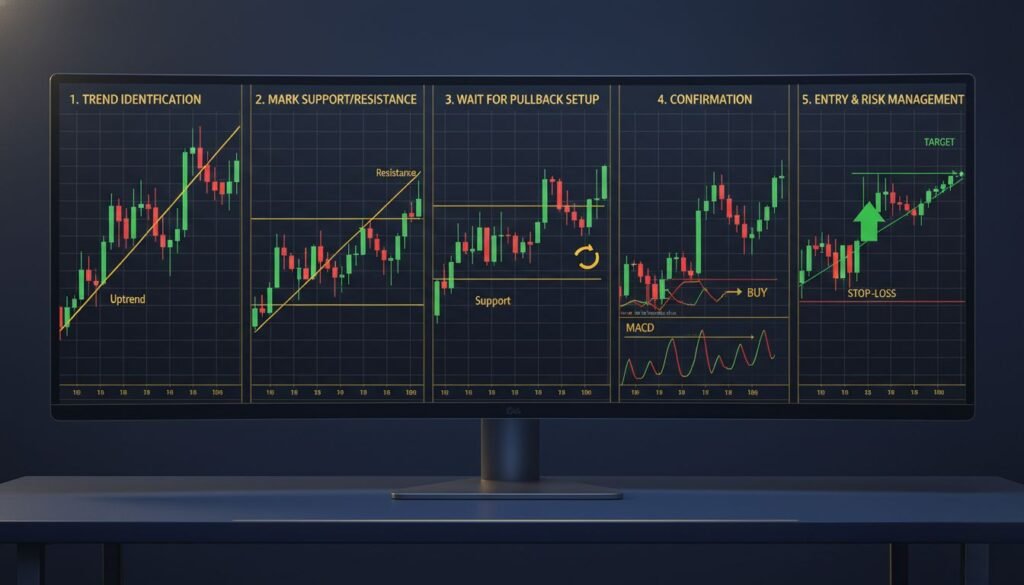
Step 1: Identify the Trend
Begin with the daily chart to get the big picture. Trading with the trend puts you on the correct side of the market and enhances the chances of success.
Step 2: Mark Key Levels
Mark support and resistance areas where price has previously responded. These levels serve as decision levels and are crucial in proper chart analysis of stock.
Step 3: Wait for the Setup
Wait and make the price come to you. Identify clean structures such as pullbacks in a trend, consolidation breakouts, or even possible reversals at critical levels.
Step 4: Confirm the Trade
Confirm the setup with a combination of price action trading and such indicators as RSI or moving averages. This is used to filter weak or false signals.
Step 5: Plan Entry, Stop Loss, and Target
Before entry, establish your entry point, stop loss as well as target. The right ratio between risk and reward is that which is sure to make even a limited number of good trades counted in the long-run.
Common Mistakes in Swing Trading Technical Analysis
Even experienced traders can slip up. Avoid these common pitfalls:
- Too Many Indicators: Makes charts complex and unclear.
- Ignoring the Trend: Going against the market lowers the chances of winning.
- Entering Without Confirmation: Failure to take signals can result in losses.
- Emotional Trading: Fear or greed should not be used as an indicator of how a decision should be made. Consistency is killed.
Advanced Tips to Improve Your Trading Results
- Price action should be combined with volume in order to verify the strength of price moves.
- Only trade setups that meet your clear criteria and concentrate on the high-probability setups.
- It is wise to avoid overtrading; by not taking up low quality signal and waiting for the best opportunities.
- Keep a trading journal so that you can keep track of your trades and improve your strategy on the fly.
Conclusion
Swing trading is effective when you have a clear and disciplined strategy for it. Learning about price action, levels, trends, and making an analysis of technical indicators prudently, you can identify high-probability setups and risk management.
The actual advantage is patience, consistency, lifelong learning, trading with some plan, following it, and having your strategy, not your emotions, lead you.